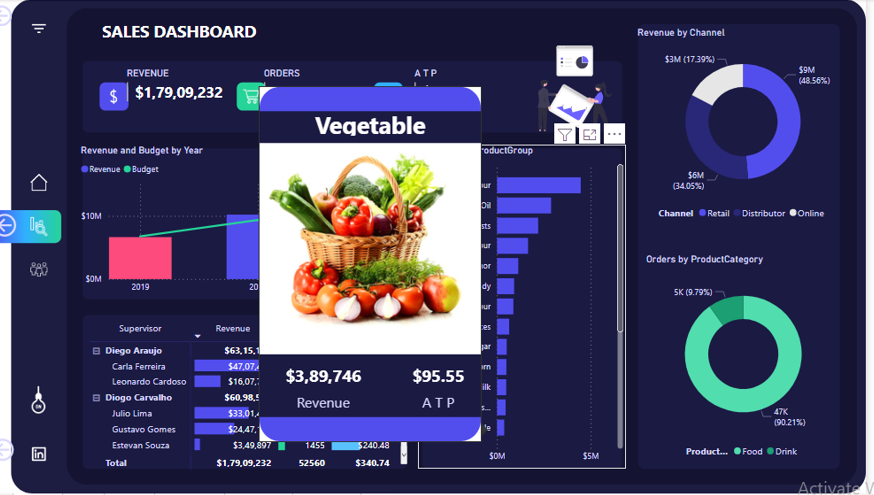
Anshu Kumar Mahto

I am a Writer

Anshu Kumar Mahto

As a freelance data analyst and Business Analytics, I translate data into valuable and comprehensible insights. My goal is to improve results, make the right decisions and save costs. I am experienced in Power bi , supervised and unsupervised algorithms and use data visualization techniques to present the results. I use SQL, R, Python, and Power Bi u for my data projects.

  • 110019 Govindpuri, Kalaji, New Delhi.
  • +91 8709133066, +91 8235772105
  • anshu182003@gmail.com
  • https://www.linkedin.com/in/anshu-kumar-436850175/
Me

My Professional Skills

I have 6 months of experience working on Power Bi. "There was an assignment test on Power Bi taken by LinkedIn which was attended by 635k people across the world And I was in the top 15%". And in SQL 3 Star on the Hacker Rank.

Power Bi 85%
Microsoft Excel 90%
SQL 70%
Python 60%

Data analyst

I am specialized in analyzing data. Results, trends and recommendations are clearly presented in reports or tools.

Business Analyst

Dashboards show the most recent results in an interactive way. By clicking and drilling, you will examine trends and patterns yourself..

Financial Analyst

Pellentesque ultricies ligula a libero porta, ut venenatis orci molestie. Vivamus vitae aliquet tellus, sed mollis libero.

Machine Learning

1. Linear Regression ,Logistic Regression , Decision Trees , K-Nearest Neighbors , Naive Bayes , Support Vector Machines ,Ensemble Learning Techniques,Semi-Supervised Learning, Unsupervised Learning, Reinforcement Learning

HR Analyst

Vivamus quis tempor purus, a eleifend purus. Ut sodales vel tellus vel vulputate. Fusce rhoncus semper magna.

0
completed project
0
design award
0
Linkedlin Followers
0
current projects
  • Sales Dashboard

    Sales Dashboard


    Project Link : https://app.powerbi.com/groups/me/reports/6d9a3ae0-5685-4b64-b4a7-371cb2b58a06/ReportSection


    About the Project 

    1. The sales manager can see how much revenue the company is earning from which zone and in which zone we need to work so that they can improve the revenue of the company.

    2. There are two types of products available in the products table so I create a chart to see what products the company is selling and how much revenue each type generates. After looking at the chart, the manager can decide which type of product the company needs to work on more.
    3. There are basically two types of customers the company has so after seeing the chart from which type of customers the company is making or revenue and give them a small offer to sell more products.

  • Sales Dashboard

    Sales Dashboard


    There are a few things that are shown in this dashboard.

    1. Overall Revenue and Budget Performance quality, Month and Year wise.
    2. Total Revenue, orders, ATP, etc.
    3. Revenue by Channel.
    4. Revenue generated by salespersons.

    And many more things.


  • GET A FREE QUOTE NOW

    Inquiries regarding any Virtual Assistant service costs? Please feel free to reach out!

    Search This Blog

    Blog Archive

    Powered by Blogger.

    Zomato Dataset Analysis Using Python

    Project link: https://colab.research.google.com/drive/1NCAPdPucX1GC3AvPnuQ2KFbi5anyvGfb?usp=sharing Video link : https://youtu.be/fnnxiH8uAW...

    ADDRESS

    110019 Govindpuri, Kalaji, New Delhi

    EMAIL


    anshu182003@gmail.com

    TELEPHONE

    775362 13
    23497 74435 467

    MOBILE

    +91 8709133066,
    +91 8235772105